Income inequality is widening, especially in the United States, which already has the widest income inequality among comparable nations. Just about everyone who pays attention knows this. The debate has now moved on to whether growing income inequality is inevitable. Should we just live with it? Is it really bad — perhaps inequality is just how economies grow? (Wrong.) But in focusing on Americans’ paychecks, we attend too little to the greater component of widening social inequality: wealth.

aging.ohio.gov
It is accumulated wealth that better defines economic inequality, in quite visible ways — the mansion on the hill versus the trailer in the flats — and in subtle but important ways, too, such as the risks some young people can take and others cannot. Go to college? Accept an unpaid internship? Start a business? Or, play it safe and take the cash register job at the supermarket?
Family wealth helps a lot. But wealth is hard to to assess — and to tax.
Show Me the Money
So much of the discussion about inequality focuses on differences in income – between, say, CEOs’ pay and their firms’ line workers’ pay – and how the top few percents’ income has soared while the rest have stalled, but income matters because it contributes to wealth.
Indeed, income is often a misleading indicator of how well off people are. A twenty-something medical student may not be making much money today but you probably like her odds of making a lot several years down the road. Many retirees have small incomes but own a big house that is all paid off and perhaps a few CD accounts, as well. Meanwhile, a fifty-something mid-level manager might bring home $100k, putting his or her family in the top third of American families by income, but have a large mortgage, a couple of kids in college, and an elderly parent needing home aid. Looking at incomes also can be misleading because in some lines of work pay can vary a lot from year to year – say, for people who depend on tourism.
The public debate may have focused on income because it is simply easier to measure and track income than it is to track wealth with all its complexities – housing values, stocks and bonds, 401Ks, personal property, etc. The housing bubble leading up to the current real estate collapse, for example, misled most Americans about the wealth they had in their homes. Moreover, it is hard for researchers and government to get good samples of and accurate reports of assets from the super-wealthy.
Nonetheless, every three years, the Federal Reserve Board via the National Opinion Research Center mounts a large survey to measure in exquisite detail the assets and debts of American families, about 6,500 of them in 2010 (pdf). The headline from the latest survey was how much wealth was “destroyed” in the Great Recession thanks to dropping stock values and plummeting house values. But here is a closer look.
- Income: In 2010, families in the top-ten percent of the income distribution brought home 4.5 times as much as families in the middle twenty percent did and about 15 times as much as families in the bottom twenty percent of the income distribution.
- Net Worth (value of assets minus outstanding debt): In 2010, the median family in the top-ten percent of the net worth distribution had 18 times as much of it as families in the middle twenty percent did and about 193 times as much as families in the bottom twenty percent of the wealth distribution.
Wealth inequality is way greater than income inequality and even these numbers on the assets gap are almost surely underestimated. (A couple of sources: here and here.)
The best guess about historical trends is that wealth inequality dropped considerably through most of the twentieth century, but has been on the rise — despite the expansion in home ownership and increase in house values — since the 1970s through the mid-2000s (see, e.g., here, here, and here).
Wealth Matters
Wealth itself, whatever people’s incomes, shapes lives. For example, couples are likelier to marry if they have some assets (see, e.g., here and here). Also, as one would expect, families make it through crises better if they have some assets to fall back on (e.g., pdf). In at least one major survey, children’s math test scores were higher if their parents had income-producing wealth, such as stocks, irrespective of the parents’ education or income (here). And it stands to reason that young people setting out to get an education or find a first job will be advantaged if they have some family assets to fall back on.
For all its importance, we rarely debate wealth taxes when we discuss leveling the playing field.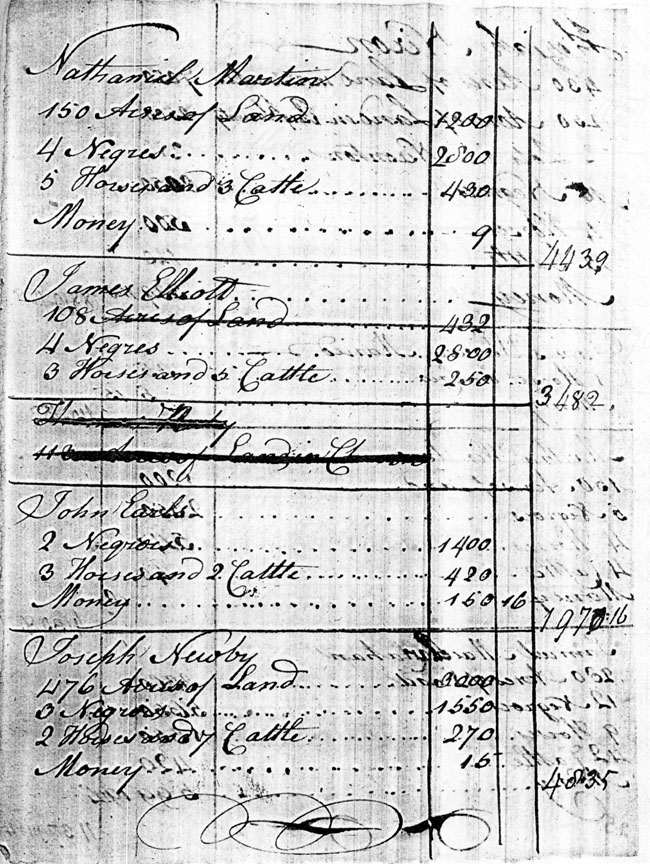
The local property tax is such a wealth tax, but is, for several reasons, an unpopular one. The estate tax — the “death tax” to its haters — directly targets wealth, but is opposed by most Americans, even though the vast majority of them have so little in assets that there is no way that they — that is, that their heirs — would ever be subject to the tax.
Yet, early in our history, American governments relied heavily on wealth taxes of various sorts. Local and state governments, in particular, taxed the value of the land, the houses, the carriages, the luxury goods — and the slaves — that Americans owned. The image on the right (from perqtax3.homestead.com) is part of a property tax list from North Carolina in 1779. It lists, as best as I can make out, for Nathaniel Martin 150 acres of land, 4 Negroes, 5 horse and cattle, and some money. That was the basis of his tax, not his income.
If we wanted to be true to tradition and have taxes that more fairly burdened people on the basis of their ability to pay, wealth may be where we should look.
Update, May 8, 2013
Economist Edward Wolff has, in conjunction with the US2010 project of the Russell Sage Foundation, updated the estimates of Americans wealth and wealth inequality following the Great Recession (pdf). The summary is:
● Median wealth plummeted over the years 2007 to 2010.
● Middle class debt exploded from 1983 to 2007, already creating a highly fragile middle class.
Their situation worsened during the Great Recession. As a result inequality of net worth,
after almost two decades of little movement, rose sharply between 2007 and 2010.
● The racial and ethnic disparity in wealth widened considerably in the years between 2007
and 2010. Blacks and especially Hispanics lost in net worth and net equity in their homes.
● Young households (under age 45) also were pummeled by the Great Recession, as their
wealth declined sharply both in absolute terms and in comparison with older households.


